The USDA has Mapped Arizona Agriculture!
Published
10/31/2014
By Julie Murphree, Arizona Farm Bureau: The United States Department of Agriculture (USDA) has mapped Arizona agriculture and you should check it out! And, women are rockin' it in Arizona in agriculture.
Lots of interesting agricultural data are available and valuable for analysis thanks to the latest census of Agriculture and other USDA surveys. In fact, the National Agricultural Statistics Service has plenty of data available online and in map form.
As the USDA Blog tells us, cartographer, Lee Ebinger likes presenting data in map form. For us, we get to discover some interesting things about Arizona agriculture with a more visual view. As USDA suggests, "A map gives anyone a chance to visualize data for multiple geographic areas as a cohesive image, providing a graphic overview of the agricultural phenomena. It also allows map readers to visually compare regions and discern patterns and relationships in the data across regions, topics and times."
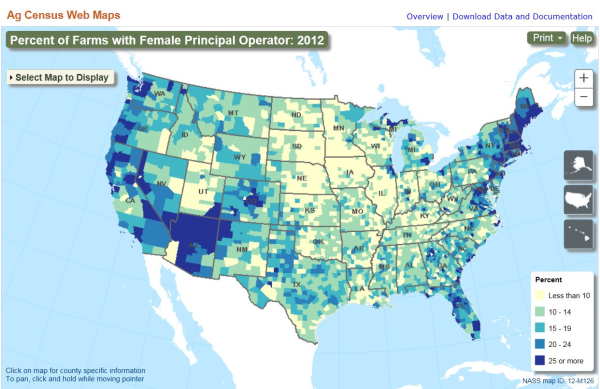
If you take the time to check out some of the data, you'll see some interesting things. One of my favorite map breakouts is the map that shows Arizona dominating the female farmer

One of the USDA maps showing data significant to American agriculture.
If you check out the information you'll discover a variety of maps based on different categories the USDA Census covers.